|
Table of Contents
Data collection and processingIntroductionThe following sections provide a complete description of an experiment at am SSRL macromolecular crystallography beamline, from shipping crystalline sample to SSRL to data collection to data processing and analysis. For additional help setting up data collection, please consult the Blu-Ice documentation. How do I get a computer account and control the beam lines remotely?A computer account for SSRL Macromolecular Crystallography is necessary for all on-site and remote access experiments. This account will allow you to log in to a virtual desktop, enable you to use the
How do I prepare my samples for robotic sample exchange?The Stanford Automatic Crystal Mounting System (SAM) is the centerpiece of macromolecular crystallography at SSRL. Enabling both on-site and remote access experiments, the SAM robot allows semi- or fully-automatic mounting and exchange of crystalline sample.
How do I ship my samles to SSRL?
How do I upload information about my samples to the beamline control software?
How do I mount a sample using the SAM robot?
Once the cassette or UniPuck is in place and the sample information spreadsheet has been uploaded, the Screening Tab in
Samples can also be mounted and inspected individually via the SAM robot interface which is found in the Sample Tab. This system is independent of the spreadsheet-based Screening Tab, and allows more extensive viewing and manipulation of the individual crystals and their crystallographic analysis, such as
How do I evaluate crystals and diffraction quality?It is useful to evaluate the crystals in the cassette and UniPuck and select the best-diffracting prior to performing the full X-ray diffraction experiment. How do I find the best-diffracting crystal(s)?The automated crystal screening procedure includes automated indexing of the collected test images, with the results (symmetry, resolution, mosaicity estimate, and an overall image score) displayed in the Screening Tab in You can evaluate the results of the screening in several additional ways:
How do I collect test images?While the screening tab will display some basic information about diffraction quality for each sample, it is nevertheless advisable to visually inspect test images collected from the most promising crystals. Test image-sets conventionally consist of two images (collected at PHI angles of 0 and 90 degrees), and are collected automatically during screening, or could be acquired manually in the Run 0 subtab of the Collect Tab. When collecting images manually, it is useful to use "coarse slicing" (i.e. 1-degree oscillation) for test snapshots, switching to "fine slicing" (e.g. 0.1-degree oscillation) for full datasets. The extent of per-image oscillation can be set via the "delta" parameter in the Collect Tab. What should I look for when examining my diffraction images?You can view diffraction images in two ways:
When inspecting diffraction images, it's useful to look for a few specific features.
How do I find the best-diffracting volume of my crystal?The rastering technique allows you to find the best-diffracting volumes of your crystal using low-level diffraction. In the Raster tab, you can use a user-friendly GUI to define a three-dimensional grid encompassing your sample; the software will scan the grid with a highly-attenuated beam, collecting low-level diffraction images and analyzing them for diffraction quality. A heat map representing diffraction quality by a certain metric (resolution, number of spots, or a combined "score") will be overlayed on top of the sample after rastering is concluded, indicating where the best diffracting volume(s) can be found. NOTE: this technique can also be used to locate crystals that are hard to see because they are small and/or obscured by ice, cryoprotectant, or precipitate. Rastering can also be used during autonomous screening or data collection to ensure that each crystal is correctly centered. How do I set up the best data collection strategy for my crystal?Choosing optimal collection parameters is an extremely important part of the structure determination process, as everything subsequent involves manipulation of the data and the model in silico. By collecting the highest quality data possible the subsequent steps will be easier and more successful. The following tutorial will help you determine the best values to use for the parameters listed below:
What rotation range and oscillation angle should I use for data collection?Fast Strategy: With the use of Pixel Array Detectors (PADs) like the Pilatus and the Eiger detectors on the SSRL beamlines, one fast and easy collection strategy is to measure a full 360° rotation of the crystal using a very small rotation (oscillation) angle, called fine-phi-slicing. To get the best data, we recommend 0.1 or 0.2 degree oscillations and short exposures (~0.2 s) per image. However, a larger oscillation (0.5 -1 degree) should be used for crystal screening or test shots. If in doubt, use the default collection parameters in Blu-Ice; we recommend examining the test images and using the resolution calculator to set the detector distance and the dose calculator to set the appropriate amount of X-ray attenuation (typically over 90% at BL12). For collecting many datasets in a hurry, the screening tab can be used to collect 360° datasets from all crystals in a puck or cassette in an autonomous mode; select the rastering option to have each crystal optimally centered during this process. Optimized Strategy: However, sometimes simply collecting 360° of data can be problematic, particularly with crystals prone to radiation damage or crystals with long unit cell edges, so a better strategy is to calculate starting and ending angle and check the rotation angle to make sure there are minimal overlaps:
What crystal to detector distance should I use for data collection?This parameter will determine the resolution limit of your data on the detector surface and ultimately the resolution and completeness of your final data set. The resolution is directly related to the angular spread of the diffracted X-rays (relative to the direct X-ray beam) from your crystal. Measuring higher angle diffraction spots (reflections equate to high resolution) requires either a closer detector distance or higher X-ray energy. A resolution predictor in Blu-Ice gives a visual representation of the relationship between the detector distance, energy and the resolution. The detector should be just close enough to the crystal to make sure all high angle reflections are measured. If you have the detector too far, the high angle reflections will be off the edge of the detector surface and will not be measured. Keep in mind, using a longer crystal to detector distance will actually increase the signal-to-noise of your collected data because the background (air) scatter decreases faster as detector distance is increased (by the square of the crystal to detector distance). If you have a very large unit cell, you may also need to increase your detector distance (as described in the previous section). What beamsize should I use for data collection?
What wavelength should I use for data collection?This can depend upon several factors. If you are collecting data from a native crystal (one containing only light atoms (C, O, N, H and S) then we recommend using the wavelength at which each beamline has been optimized. Generally this is the selenium absorption edge (12658 eV, 0.9795 Å) for beamlines BL9-2, BL12-1 and BL12-2, and just above the gallium K-edge (10375 eV, 1.1950 Å) for beamline BL14-1 (as synchrotron scientists, we have a tendency to describe the X-ray wavelength in electron-volts rather than Angstroms, and the energy widget on the Hutch Tab in Blu-Ice allows you to change between the two units). At these wavelengths, beam intensity is maximized and air absorption is minimal. Like the crystal to detector distance, changing the wavelength will change the resolution at the edge of the detector, and you can use the resolution predictor on the Hutch Tab in Blu-Ice to test the relationship between the X-ray wavelength (or energy), the distance and the resolution. If your protein crystals contain a heavy atom and you wish to utilize these atoms to help solve your structure using MAD or SAD phasing, you should consult the directions on how to measure a MAD scan, and also talk to your User Support person if you are unsure how to do these specialized data collection experiments. What exposure time and attenuation should I use?To get the best data, we recommend you keep a consistent exposure time and rotation range of 0.1 degrees oscillations and 0.2 s exposures per image. Then you should increase the attenuation (reduce the X-ray transmission) to optimize the total X-ray dose on your crystal. Once you have determined the start, end and oscillation angles for your dataset (such as using iMosflm strategy), use the Run Dose Estimate window in the Collect Tab in Blu-Ice to determine the optimal X-ray transmission settings (the amount of X-ray attenuation to use). This calculator will compare the X-ray dose from your input collection strategy with a suggested dose limit, which is defined as the dose which reduces the sample to half its diffracting power or the loss of useful anomalous signal. You should select a dose limit based on your experiment, such as under 30 MGy for experiments performed at ~100 K, or 3 MGy for sulfur SAD experiments at ~100 K, or only 0.38 MGy for room temperature experiments. NOTE: Fine sliced images with the correct exposure time look very weak - this is to be expected, as all the reflections are partials, and you should refrain from increasing the exposure time until the pattern looks strong, since this may result in rapid radiation damage. Rather than increasing the exposure time, if your data collection strategy does not exceed the maximum suggested X-ray dose, we suggest to instead collect a larger rotation range to increase the multiplicity of your dataset.
Trade-offs: As you reduce the x-ray transmission, the highest angle diffraction may become weaker and eventually fall off – reducing the resolution of your dataset. However, if you do not lower the x-ray transmission, your crystal may be damaged during data collection, which will cause fall-off of diffraction resolution during data collection lowering the completeness of the dataset, visible in the data collection strip chart. Therefore, in some cases, you may need to combine data from multiple crystals to optimize the resolution and completeness of your dataset. Here is a tutorial for combining multiple datasets using How do I collect an X-ray diffraction dataset?Once a promising crystal has been identified, X-ray diffraction data can be collected via the Collect Tab in
To get more strategy advise on the optimal parameters to use in the Collect tab, we suggest reviewing the data collection strategy portion of this User Guide. How do I set up screening or data collection to run autonomously for multiple crystals?The spreadsheet display window of the Screening Tab includes a checkbox next to each listed sample. Any subset of these can be selected prior to screening, ranging from a single sample, to several, to all of them. After that, automatic screening is as simple as pressing the "Start" button, although the specific screening action sequence can also be customized. Instead of collecting test images, the automated screening procedure can be set up to collect a larger (up to 360°) dataset for each crystal.
How do I monitor diffraction quality and radiation damage?The Collect Tab includes a diffraction quality strip chart, which enables real-time monitoring of the experiment. The chart displays basic statistics for each frame collected, allowing you to see trends in crystal behavior as it's exposed to the X-rays. For example, a clear deterioration of estimated resolution would indicate possible accumulation of radiation damage. A drop or gain in diffraction resolution during data collection can also occur if the crystal is not well centered in the X-ray beam, or if the crystal volume exposed or crystalline order varies with rotation direction. The results displayed in the strip chart can also be cross-checked against the overall run dose estimate; taken together, this information can suggest a change of strategy for the next run. Furthermore, beamline 9-2 is equipped with an inline UV-vis microspectrophotometer. While useful for a variety of applications, the microspectrophotometer can be utilized to monitor the X-ray exposure of a crystal during data collection. How can I tell if my protein contains a metal in the active site?Determining whether your protein of interest contains one or more coordinated metal ions, as well as identifying their types, is useful for a variety of applications in structural biology. The Excitation Scan feature found in the Scan Tab can be used for this purpose. Additionally, the MAD Scan feature can be used if a specific metal or heavy atom is present in the structure, for the purposes of determining the optimal energies for single- or multi-wavelength anomalous dispersion (SAD/MAD) data collection. How can I get the most out of an extremely large or long crystal?In cases where a crystal is much larger than the available beam size, and especially if the crystal is very long, helical data collection is an appealing option. In a helical approach, oscillation images are collected while the sample is translated along a pre-determined path. This technique
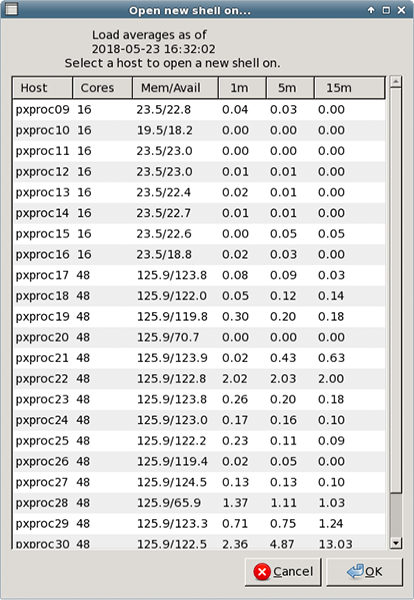
How do I process the data I have collected?Once a data collection Run has completed with 5 or more images, the data are automatically processed using ICEflow - an SSRL automatic pipeline that runs several 3rd party data processing pipelines (for example, autoPROC) that provide quick feedback on the quality of each data set. The processing run information is also displayed in the Processing Tab if a spreadsheet has been assigned to the cassette. For more information, see the Processing Tab documentation. If you prefer to process the data on your own, SSRL-PX computing offers a powerful data processing environment with the latest stable versions of all major data processing packages installed, configured, and tested. How do I view the results of automated data processing and what programs are used for this?The automated data processing pipeline writes results to a folder on the user's data drive. A symbolic link to that folder is created in the data collection folder and looks like this:
where ‘3rd_party_software’ is the name of the software employed by ICEflow to carry out the automated processing (for example, autoPROC).
The link leads to a folder on the data drive with a path that looks like this:
In these folders (or one folder up, in case of autoPROC), a README file can be found which lists the version of ICEflow that was used, the path to the image files, the 3rd party processing software, versions, program references and the shell scripts used to run the autoprocessing pipeline. Consult the documentation on the autoprocessing directories for more information.
How do I access the SSRL-PX data processing environment?The following directories are accessible from all SSRL-PX computers and remotely when you log into your user account:
What data processing software is available for my use?Commonly used software packages for data processing are available at the macromolecular crystallography beamlines. SSRL-PX currently offers tutorials for the following software:
For a complete list of supported and unsupported software installed on the SSRL-PX computing cluster, see our software webpage. What structure solution and refinement software is available for my use?
For a complete list of supported and unsupported software installed on the SSRL-PX computing cluster, see our software webpage. |
||||
|
|
||||
| Technical questions: Webmaster
Content
questions: Aina Cohen |
||||
| Last modified:Tuesday, 05-Nov-2024 13:15:18 PST. | ||||