Screening Tab
Overview
The Screening Tab (Fig 1.) provides an interface for
automatically screening samples using the SAM system. With this
interface, the user selects multiple samples of interest from an
embedded spreadsheet and defines the actions to be performed on each
sample. Once started, the interface can run with minimal supervision
until all of the samples have been screened identically.
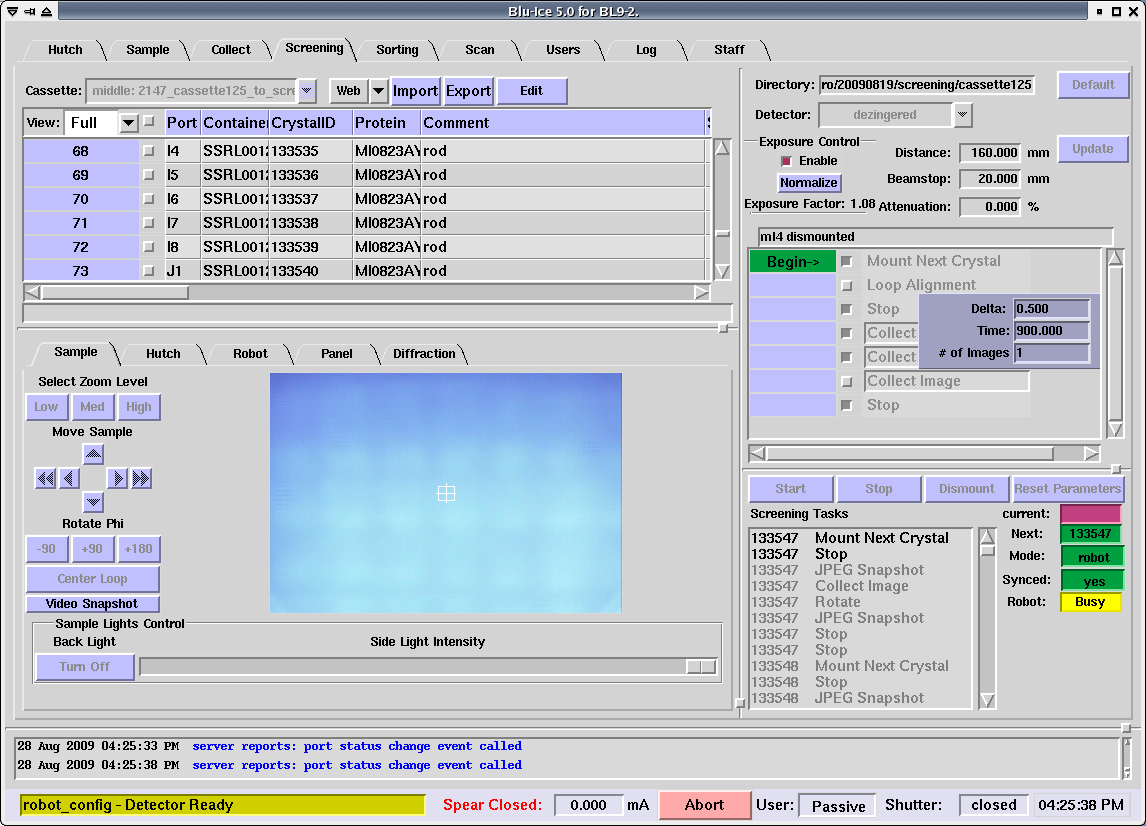
[Fig 1] The Screening Tab in Blu-Ice
The screening tab is divided in four different parts (modules or
widgets) by one vertical and two horizontal lines. The widgets can be
resized by clicking on the resize button  on the dividing
line and dragging it in the desired direction. on the dividing
line and dragging it in the desired direction.
Uploading Crystal Information from an Excel Spreadsheet
Before automatically screening samples in a cassette, the system
must first have some basic information about each sample in the
cassette. This information is entered into an Excel spreadsheet and
then uploaded through a web browser. Templates for the spreadsheet
can be downloaded from the Sample Database. The template can be edited using Microsoft Excel or the
spreadsheet editor which comes with OpenOffice running on a Unix
system. Detailed instructions for the content of the spreadsheet can
be found in the Users'
Guide. Once the information has been entered into the
spreadsheet, the spreadsheet is then loaded into Blu-Ice in one of 2
ways:
- Via the SSRL database which is accessed by clicking the Web button
and choosing the Spreadsheet option on the
Cassette Definition Import Menu (Fig. 2) on the Screening
tab. Please see the Users'
Guide for detailed instructions on how to use the web interface
for loading Excel information into the database and assigning the
information to a particular cassette position at a particular
beamline.
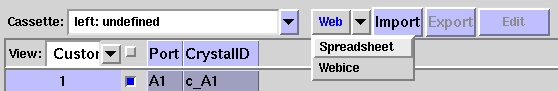
[Fig 2] Cassette Definition Import Menu
By direct upload from the local file system by first selecting the
left, middle or right cassette position in the
Cassette Definition Import Menu (Fig. 2) and then clicking the
Import button; for this option, the Excel file must be first
transferred to a local SSRL computer at the beamline or processing
computer. Verify that the cassette position is correct.
Once the information has been loaded correctly, using either method, the
spreadsheet information should be displayed in a table format (Fig. 3).
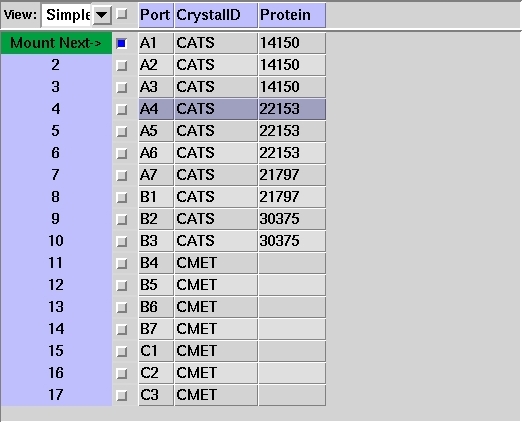
[Fig 3] Spreadsheet display window
Viewing and Selecting Samples
The Spreadsheet window (Fig. 3) can be used to select the
samples to be screened. This window will list the samples in the
order that they were defined in the original Excel spreadsheet.
Only three of the columns present in the spreadsheet are used by
the screening system as described here:
- Port: refers to a port in the cassette. The robot will
go this port to retrieve the sample.
- CrystalID: this label is used by the screening system to
generate filenames. It is recommended that a unique ID be used
for each sample.
- Directory: If provided, this field will be used to
generate subdirectories for each sample under the root screening directory.
The default template Excel spreadsheet uses the Port as
the subdirectory name. However, if no spreadsheet is loaded into
Blu-Ice, all the images will be written to the same
directory.
Other columns are displayed for information purposes. They can be
excluded or reordered as explained below.
To the left of the Port column are check boxes used to
select samples for screening (the box is blue when selected). These
individual check boxes can be clicked to select or deselect all the
samples. At the top of this column is a Global selection check
box that can be used to select or deselect all the samples. Please
note: By default, all samples are selected when the spreadsheet is
first loaded into Blu-Ice.
Port Status Indicators
The leftmost column in the Sample Information Widget
(Fig. 3) indicates the status of the cassette port.
- The
 indicator shows the sample
that is currently mounted on the goniometer. indicator shows the sample
that is currently mounted on the goniometer.
- The
 indicator shows which
sample will be mounted after the screening actions are completed
for the currently mounted sample. The next sample scheduled for
mounting can be changed interactively by clicking on the Port
status field of another sample. indicator shows which
sample will be mounted after the screening actions are completed
for the currently mounted sample. The next sample scheduled for
mounting can be changed interactively by clicking on the Port
status field of another sample.
Other Port status indicators will indicate a problem. An
unusual status indicator in this field will sometimes prevent
selection of the sample for mounting again. Possible status indicators
include:
- Empty: The robot did not sense a sample in this
port.
- Port Bad: The robot experienced
excessive force while attempting to remove the sample from the
port.
- Port Jam: The robot experienced excessive force while
removing or returning the sample to the port. (Typical causes: pin
out of tolerance, glue on pin, ice on pin, or microtube fell out of
pin.) If the port jam happens when the sample is removed from the
cassette, user support staff must inspect the robot and perform a
reset procedure to recover operation of the robot.
If the port jam happens when the sample is returned to the cassette,
the robot can strip off any pin attached to the dumbbell magnet
without staff intervention. Because in a few cases this may result in the sample
being lost, the interface shown in Fig. 4 will appear to prompt the user for
confirmation.
Once a pin causes a port jam of any kind, the port will become
disabled (i.e., the sample cannot be mounted again with the robot).
|
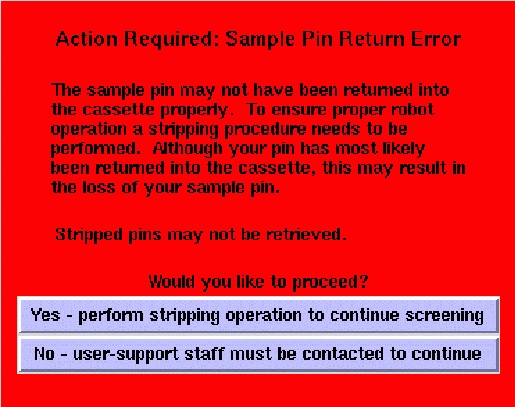
[Fig 4] Sample stripping interface
|
Customizing the Spreadsheet Layout
After successfully importing the cassette and sample information
into Blu-Ice, the spreadsheet is displayed in a table format. The
number and format of the spreadsheets displayed can be customized by
the user by using the following tools:
- The View pull-down menu to the left of the Column headers
(see Fig. 5).
- The column editing menu displayed when moving the mouse over the
column headers (Fig. 6a).
- The mouse "click and drag" commands to change the size and
positions of the column (Fig. 6b and c)
The spreadsheet View pull-down menu (see
Fig. 5) offers the following options:
- Full View: Displays all the columns that are
present in the original Excel file.
- Simple View: Shows only the Port,
CrystalID, and Protein columns.
- Results View: Shows the results returned from
WebIce, including the Score and UnitCell for each
sample.
- Save Custom View: Saves the current view for use
with future Blu-Ice sessions. The format information file is saved to
the directory /home/userid/.bluice/show_column. If the user saves the
custom column outlay as ".dflt.cln", it will become the default for
subsequent sessions.
- Load Custom View: Loads a previously
saved view.
- Refresh: Reloads the spreadsheet contents.
|
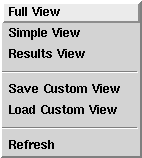
[Fig 5] File View Menu
|
[Fig 6a]

[Fig 6b]
[Fig 6c]
Selection and configuration of spreadsheet columns
|
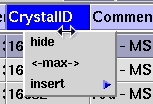
The column editing options (available by placing the
mouse over the spreadsheet field header) are:
- Hide (Fig. 6a): Clicking on this drop-down menu option hides the
column from the current view.
- Insert (Fig. 6a): Clicking on this option displays a list of
spreadsheet columns. The user can select one of them to be
inserted to the left of the current column. Note: This option is
available only for hidden columns; displayed columns will be
grayed out in the selection list.
- Maximize(< -max- > in Fig. 6a): This expands the width of
the column to match the maximum width of its contents.
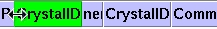
- Resize (Fig. 6b): The column can be resized by moving the
mouse to the right of the column header until a tab symbol appears;
click and drag the mouse toward the right to increase the
column width; or toward the left to decrease it. The column
header is highlighted in green while this command is active.
- Move (Fig. 6c): Clicking on the column header allows moving
the column to a different position, by dragging the mouse either
to the left or right. The column
header is highlighted in green while this command is active.
|
Screening Configuration
Many of the data collection parameters used during screening can be set
using the interface on the screening tab shown in Fig. 7.
The Directory entry box specifies where the screening
results will be stored. The user's Unix account must have write
permissions to this directory, otherwise screening will not start.
The Default button changes the directory to the current user's top
level data directory. Subdirectories can be added. During screening,
the directory will be automatically created if it does not exist. If
the sample information contains a directory for each sample, the
directories will be subdirectories of this entry box.
The detector mode can be selected, as explained in the Collect Tab documentation
The detector distance and beamstop distance
can also be specified. The detector and beamstop will move to the requested
distances when images are collected during screening.
Clicking on the Update button will change the values in the entry widgets to match
the actual physical values of the detector distance and beamstop distance.
Clicking on the Update button will not move the detector or beamstop from
their current positions.
Attenuation can also be selected to move filters into place during screening
to attenuate the beam. Clicking on the Update button will change the value
in the entry widget to match the current value of Attenuation. Update will
not move any filters into or out of the beam path.
Exposure Control (former dose mode)
may be chosen via the Enable radio button in the Exposure Control panel.
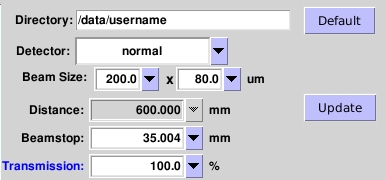
[Fig 7] Directory and Detector Interface
Screening Action Sequence
The Screening Sequence interface (Fig. 8) allows the user to
configure actions to be performed for each sample. The interface
consists of a list of actions with a check box next to each action. An
action with a selected checkbox indicates that it will be performed
during the screening process. Some selections are permanent and will
be performed automatically for each sample during screening. These
permanently selected actions are "Mount Next Crystal", and the first
"Collect Image". The dark green color of these check boxes indicates
that they cannot be deselected. "Loop alignment" can be deselected,
but if this is done the following "Stop" will become automatically
selected; this is done to ensure that the sample is centered, either
automatically or by the user, before diffraction shots are collected.
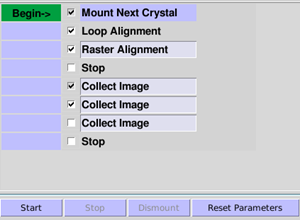
[Fig 8] Screening Action Interface
The following is a summary of the available screening actions:
- Mount Next Crystal - Mounts the sample indicated by the
indicator in the
Sample Information Widget. If a sample is already on the
goniometer, it will be dismounted and returned to the port from
which it came. This action also creates a directory for the
output files to be generated for the new sample. Once these
actions are complete, the indicator will be
replaced by the indicator.
- Loop Alignment - This action performs an automated loop
alignment procedure. Video images of the sample are taken at
different magnifications and phi rotation angles to determine
the position and face of the loop. The loop is then centered on
the beam. Note: If this check box is deselected, the next Stop
will be automatically selected, to provide a chance for the user
to center the sample manually.
- Raster Alignment - This action performs an automated crystal alignment procedure using low-dose X-rays.
The Raster Parameter Window appears by hovering over Raster Alignment (Fig. 9A & 9B ). A choice of beam size can be selected for the rastering process (a larger beamsize is faster; a smaller size provides more precise alignment). On beamline 9-2, only 2 choices are provided; one for crystals smaller than 200 um and for crystals larger than 200 um. If you have a mix of crystal sizes, use the <200 um option. The default Transmission and Exposure Time Per Grid Point is displayed for the beam size selected. If a different value is used, a warning indicating a value other than the default value is being used. The "Reset to Default" button allows the default parameters to be restored. The size of the raster is determined by the Loop Alignment procedure (when Raster Alignment is selected, "Loop Alignment" is automatically selected). If rastering fails, the sample will be aligned to the center of the loop.
On BL12-2 an estimate of the crystal size is determined from the rastering results which can be used in subsequent Collect Image actions (i.e. for collecting snapshots or collecting full data sets). Otherwise the beamsize specified in the screening configuration (Fig. 7) will be used for subsequent actions.
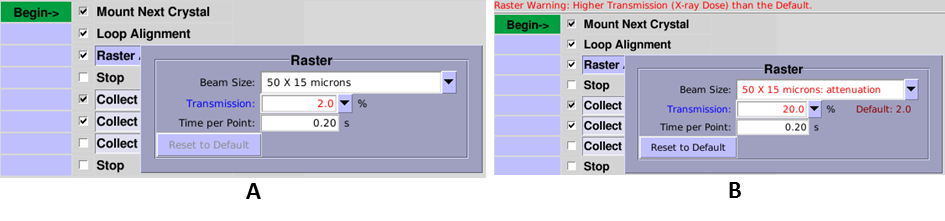
[Fig 9] Rastering options A: example default settings, B: when the X-ray dose per grid point is increased
- Stop - is optional for pausing the screening process
(unless Loop alignment is deselected)
allowing manual centering of the sample. Normally this is not
required if the loops and crystals are smaller than the beam
size. To continue the screening process, depress "Start" on the
Screening Action interface (Fig. 8).
- Collect Image - This action performs data collection of single images or it can be used to collect
complete data sets. The Collect Image parameter window appears by hovering over Collect Image (Fig 10).
- Setup for Dataset button - Clicking on this button activates a single Collect Image run with default values for Delta,
Time, and # of images/Phi Range.
- Match Beam Size check box - uses the estimated crystal size from rastering to set the optimal beam size,
otherwise it uses the beam Size selected in the Screening Window.
- Delta - angular range of Phi (degrees) per image.
- Time - exposure time (seconds) per image.
- # of images - can be used to collect a series of images (starting from the current phi angle) for use in cell refinement in
MOSFLM for example or to collect a complete dataset. It is highly recommended to center the crystal using rastering when collecting data sets.
- Rotate by - This field is available in the 2nd and 3rd Collect Image actions and indicates the Phi angle (degrees)
relative to the first Collect Image. The default values are 90 and -45 degrees for the 2nd and 3rd Collect Images, respectively.
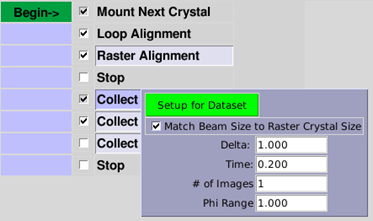
[Fig 10] Collect Image
The image filename is constructed as ID_image# with extension .img for Q315 images, extension
.mccd for MAR325 images and extension .cbf for Pilatus and Eiger images. The video image file is in JPG format.
Starting and Stopping Screening
Once the samples have been selected for screening and the screening
actions have been configured, the screening process can be started.
The Screening Control Interface (Fig. 11) is used to control the
screening process.

[Fig 11] Screening Control Interface
A summary of each button in the Screening Control Interface is described below:
- Start - initiates the screening process. The commands
that are selected in the action sequence menu will be executed
sequentially and will loop until a stop is encountered or until
there are no longer any 'selected' samples.
- Stop - stops the screening process after the current
action completes.
- Dismount - dismounts a sample from the goniometer and
returns it to the cassette.
- Reset Parameters - replaces the all screening parameters (including Raster Alignment) with default
values.
Screening Status
The screening status is displayed just above the Screening
Action Interface.
The left most column in the Screening Action Interface is
used to indicate the starting point of screening or the current
action. The  arrow beside an action will
indicate that the screening sequence will start with this action. Once
the action sequence is started, a arrow beside an action will
indicate that the screening sequence will start with this action. Once
the action sequence is started, a  indicator will point to the
action currently being carried out. For example, when the robot is in
the process of dismounting one crystal and mounting the next, the
window will display the following: indicator will point to the
action currently being carried out. For example, when the robot is in
the process of dismounting one crystal and mounting the next, the
window will display the following:
during loop alignment the following will be displayed:
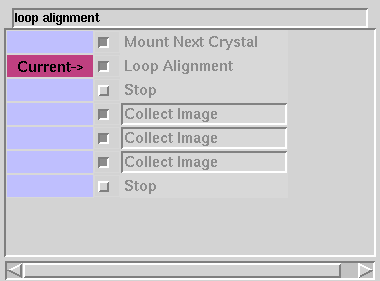
and during crystal rotation:
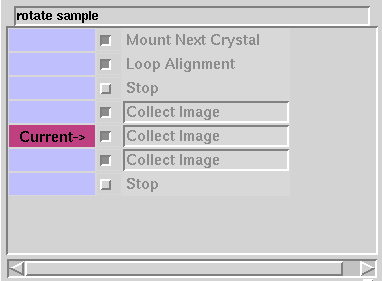
When screening is stopped, the arrow can be moved by clicking
in the left column next to a different action. This is useful for repeating or skipping an action.
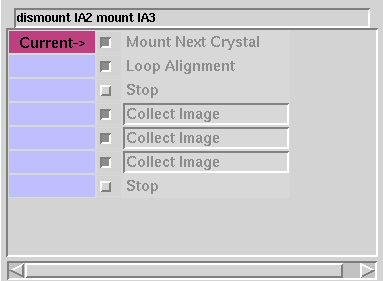
Additional status indicators can be found to the right of the
Screening Task Window (Fig. 12). These indicators are described below:
- Current: shows which crystal is currently mounted.
- Next: shows which crystal will be mounted next.
- Mode: indicates whether the robot is in automatic or manual mode.
- Synched: indicates whether the robot is synchronized with the spreadsheet.
- Robot: indicates one of three states of the robot:
 The robot is in a normal state, ready for operation. The robot is in a normal state, ready for operation. The robot is currently performing an action. The robot is currently performing an action. The robot requires user support staff inspection. The robot requires user support staff inspection.
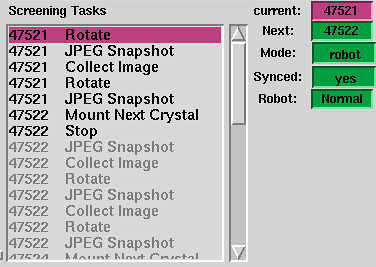
[Fig 12] Screening Task Window
Screening Task Window
The Screening Task Window (Fig. 12) displays a list
of all the samples and actions to be performed based on the crystals
and actions selected. Entries displayed in black in this task window
will be executed when "Start" is clicked. (If there are no "Stop"
actions for example, the entire list will be black and will be carried
out to completion.)
The top action in the list will be highlighted in purple if
it is currently being executed, and the action will
be removed from the list when completed. If there is a "Stop"
selected in the Screening Action Interface, the actions up to
that point will be black and the remaining actions will be grayed out.
Sample and Hutch Real-Time Video Display
The image of the sample can be viewed in this window by clicking on
the Sample Tab. This is the default video display during
sample mounting, loop alignment, crystal rotation and image
collection.
The sample can be manually centered by 'pointing and clicking' on
the part of the sample to center. This behaves exactly the same
as the Sample Window in the Hutch Tab. The zoom
level can be selected and phi can be rotated from this
window.
The Video Snapshot button can be used to save an image of your
crystal in jpg format. You will be prompted to enter an image file name.
Selecting Hutch or Robot will display video feeds of
the diffractometer, sample surroundings and robot. See the Video Widget documentation for a
description of all the video presets.
Data Collection Strategy
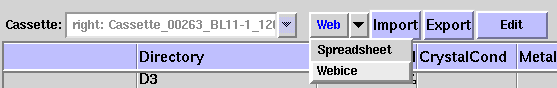
[Fig 13] Link to WebIce
Choosing the Web -> Webice option (Fig. 13) will open a browser window
and take you to the Screening tab of WebIce. If you have selected
"Stop" after collecting two images in the Screening Action Interface (Fig. 8),
then the View Strategy button in WebIce will be active, and you will be
able to view the results of strategy calculations carried out in mosflm.
See the
WebIce guide for more information. The Autoindex tab in WebIce can be
used to calculate a strategy for any samples for which you have collected
two test images using the screening interface.
Collecting Data after Automated Screening
If your sample isn't already mounted on the goniometer, there are two methods
for mounting crystals from a cassette and proceeding with data collection:
Option 1
- Use the Sample Mounting Robot Control Window in the Sample Tab to mount
and dismount individual samples.
Option 2
- Deselect all the samples in the Sample Information
Widget. Then select a sample to mount.
- In the Screening Action interface, select the "Stop"
which follows "Loop Alignment".
Once the sample is mounted as described above it is possible to refine
the crystal centering; try to improve the diffraction by sample
annealing or washing ice off the
sample; collect MAD or excitation scans; or
collect a data set.
Saving Screening Results
All the information entered into the screening spreadsheet is saved
in a database. You may save a spreadsheet to the local file system using
the Export button above the spreadsheet display window (Fig. 13).
Alternately, you may access the Sample Database via the
crystal server. After logging in, the browser displays a list of the
spreadsheets previously uploaded to SSRL together with a link to "Download
Results" for each spreadsheet. If a spreadsheet has been used during automatic
screening, the image analysis and autoindexing results will be in the spreadsheet.
|