|
Helical Collect Tab
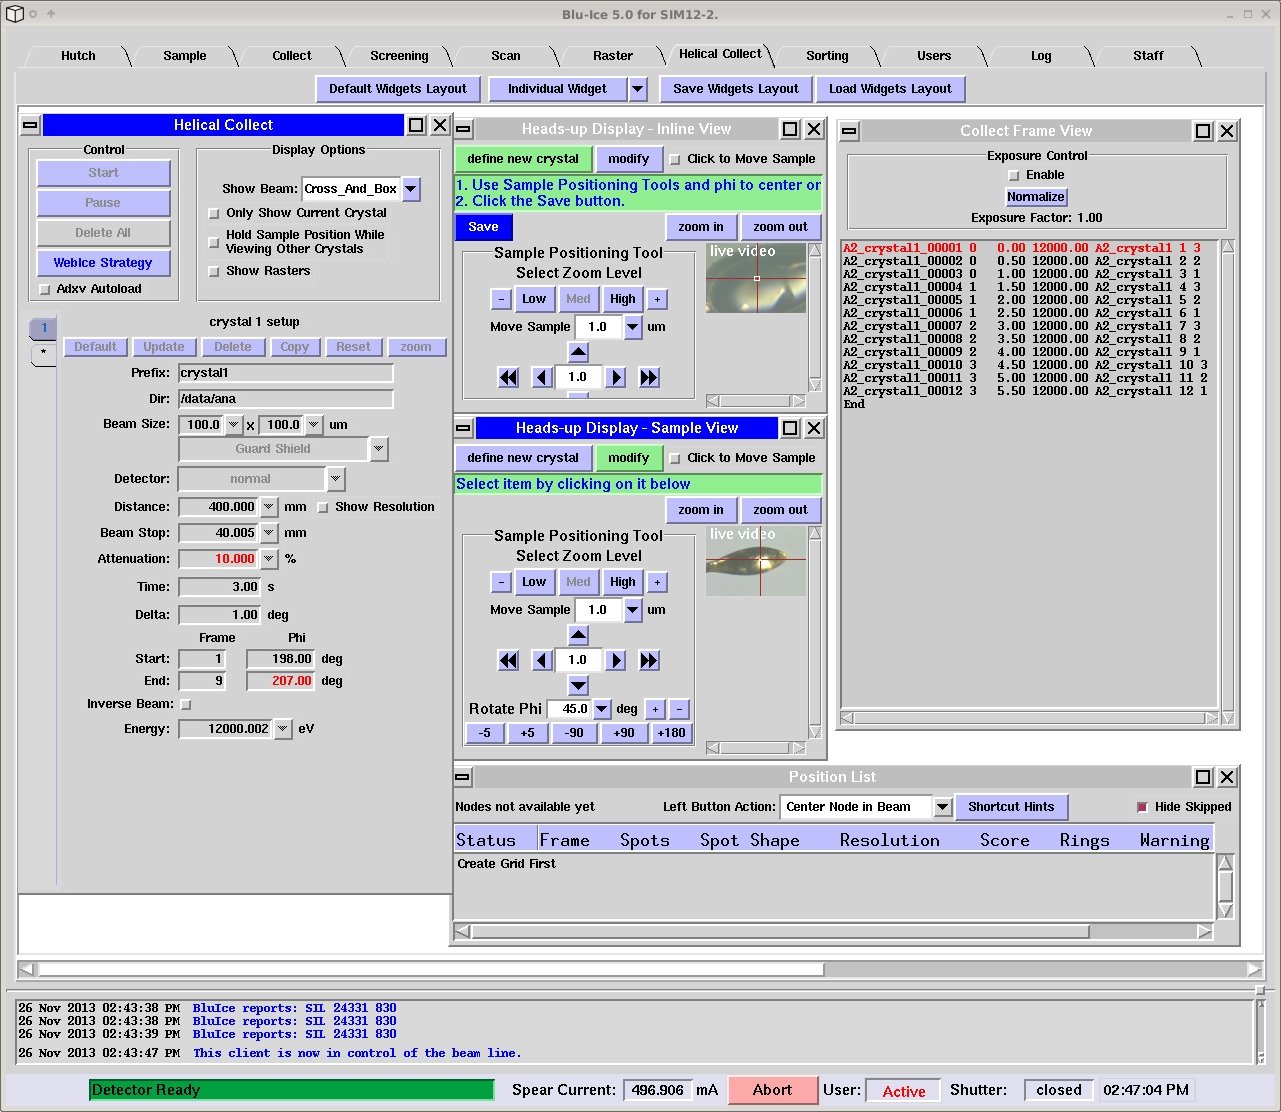
The Helical Tab allows collection of oscillation data while translating the crystal along the spindle axis: The software collects one oscillation image before moving the crystal to a new position and collecting a new image, with the new oscillation starting where the previous one ended. While in general, the best strategy to minimize radiation damage is to collect from the largest possible volume of the crystal, the helical data collection is advantageous when the crystals are larger than the beam in the horizontal (spindle) direction, or when the crystals are inhomogeneous and the diffraction quality varies along their length. If the beam size at the beamline can be set to the crystal size and you wish to minimize radiation damage, *DO NOT* use helical data collection as the diffracted intensity/dose ratio is maximum when the beam size matches the crystal size! The Blu-Ice interface makes it possible to define the translation axis along the crystal and the size of the beam (FWHM), as well as other data collection parameters such as the oscillation range per image and the exposure time/attenuation per image. Helical Collection Tab Widgets
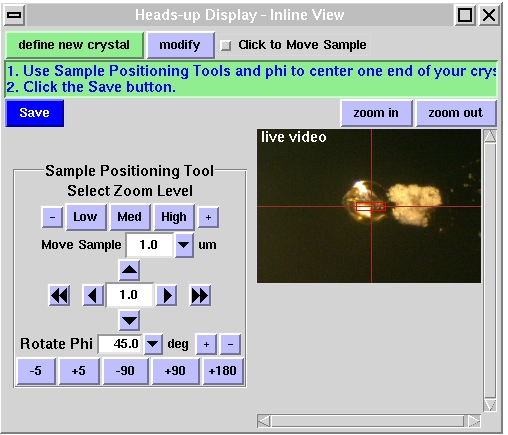
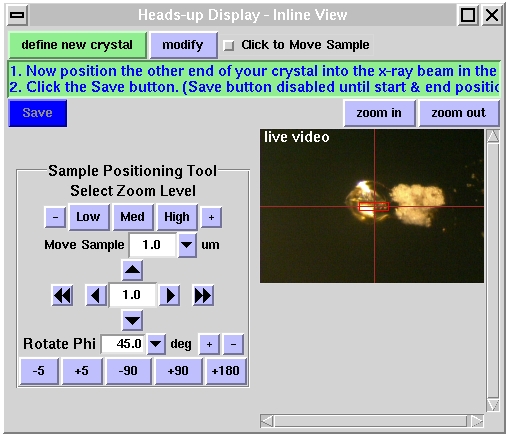
Defining the Helical Collection PathThe Helical data collection starts by defining the section of the crystal for helical data collection using the define new crystal button in the "Heads-up Display-Inline View" (available on BL12-2) or the "Heads-up Display - Sample View". The interface displays a message describing the process to select the two ends of the crystal for helical data collection (Figure 3). The first step is to define one end of the crystal by centering that end in the beam, using the Sample Positioning Tools described in the Sample Tab: Click-to-center the sample at two orientations 90 degrees apart) and then clicking the Save button (Figure 3, left panel). In the second step, the same process is repeated for the other end of the crystal. (Figure 3, right panel).
Once the second point is saved, the software draws a white line joining both points, which indicates the helical collection axis, and blue boxes at the different positions at which data will be collected. The number and distance between the boxes is determined by the distance between the start and end points and the current beam size, and their size is equal to the size of the beam as seen from the camera -ie, when the blue box turns into a line, it means that the crystal will be rotated 90 degrees at that position. The position of the start and end points can be changed by clicking on the Modify button; the beam size and phi position can be changed in the Helical Collect widget. If you want to start over, use the Delete button.
Defining the Helical Collection Path using Raster Tab ResultsWhen it is difficult to see the crystal in the sample mount or the crystal is split or highly mosaic, one may need to use low dose X-ray rastering to locate the crystal or its well diffracting portions before defining the helical collection path. The raster tab can be used for this purpose:
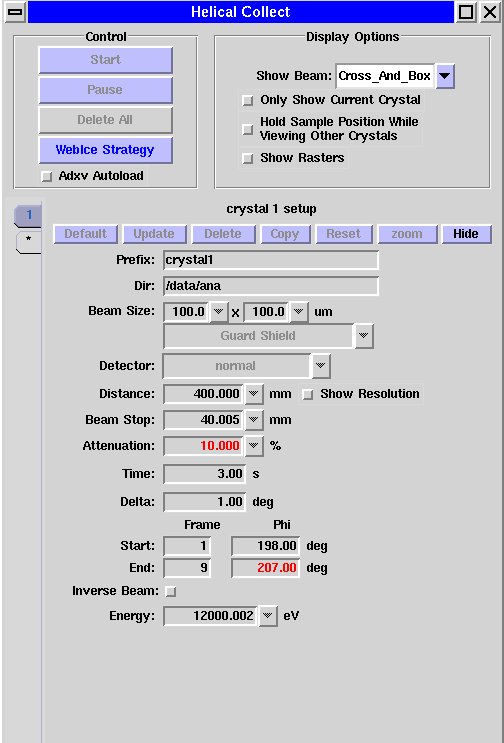
See also this document for an illustrated description of the above procedure. Defining the Helical Collection ParametersAs soon as the crystal is defined, a new run is created for the selected crystal in the "Helical Collect" widget (Figure 3). This widget is used to select the image file prefix and directory and the collection parameters, such as the detector and beam stop distances, energy, attentuation and exposure time, and start and end file. There is also an option to change the selected collimator (on BL12-2) and the beam size. Once the helical run is defined, the data collection can be started and stopped with the Start and Pause buttons.
MAD and SAD data collectionMAD data collection in wedges is not supported in the Helical Tab: each image collected at a different position along the crystal is defined as a wedge, and it takes a prohibitive amount of time to change energy for each image. However, SAD data collection in inverse beam can be selected by clicking on the Inverse beam button. This will collect a second image at 180 degrees before translating the crystal to the next position. MAD data collection from a single crystal can be done by using the Copy button mentioned above to clone the run, and repeat the same helical pass at a different energy. To mitigate radiation damage, the best practice is to collect a relatively small angle per helical run Once the same angle range has been collected at two or more energies, the runs can be copied again, this time increasing the starting phi and image number. Monitoring the Data CollectionThe Collect Frame View widget shows the details of the frames that will be collected during the helical data collection. It shows the frame name, position information, starting phi value for that frame, wavelength, file prefix, frame number, and the total number of frames left to collect in that position. The diffraction images are displayed in the Diffraction Image View widget, with the same functionality as on other Blu-Ice tabs. |
||||
|
|
||||
| Technical questions: Webmaster
Content
questions: Irimpan Mathews |
||||
| Last modified:Wednesday, 06-Mar-2024 17:47:32 PST. | ||||