
|
Spreadsheets
A spreadsheet represents a container of crystal samples that you bring to the beamline. Spreadsheets are the primary way to provide sample information that is then stored in the Crystal Server database. Note - Currently a spreadsheet must be uploaded and assinged to a beamline to see automated data processing results in Blu-Ice and the Crystal Server. Create a New SpreadsheetNew spreadsheets can be created by clicking the Create New subtab under the Spreadsheets main tab (Fig. 1) and then entering an optional spreadsheet name and selecting a container type (SAM Cassette, Uni-puck, or SSRL Plate). Spreadsheets can then be downloaded, modified and uploaded to the Crystal Server database or uploaded directly to the database for quick use. 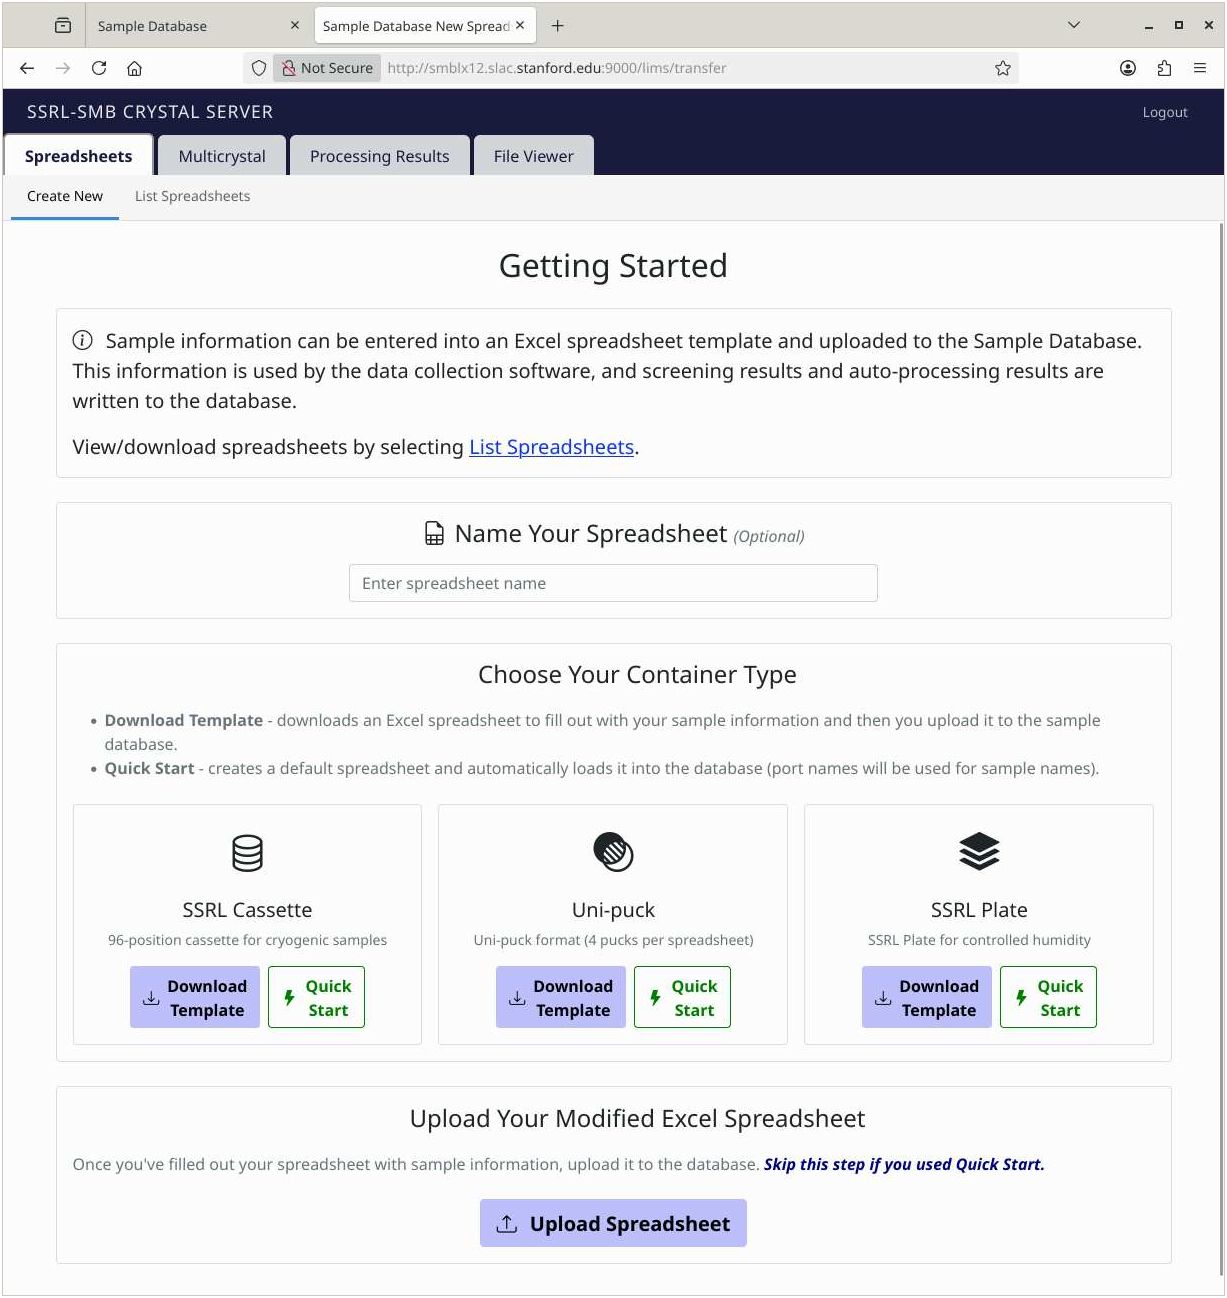
Figure 1. The Create New tab can be used to create a sample spreadsheet. There are two choices to create a spreadsheet:
List SpreadsheetsClick on the List Spreadsheets subtab under the main Spreadsheets tab to view a list of your spreadsheets (Fig. 2). 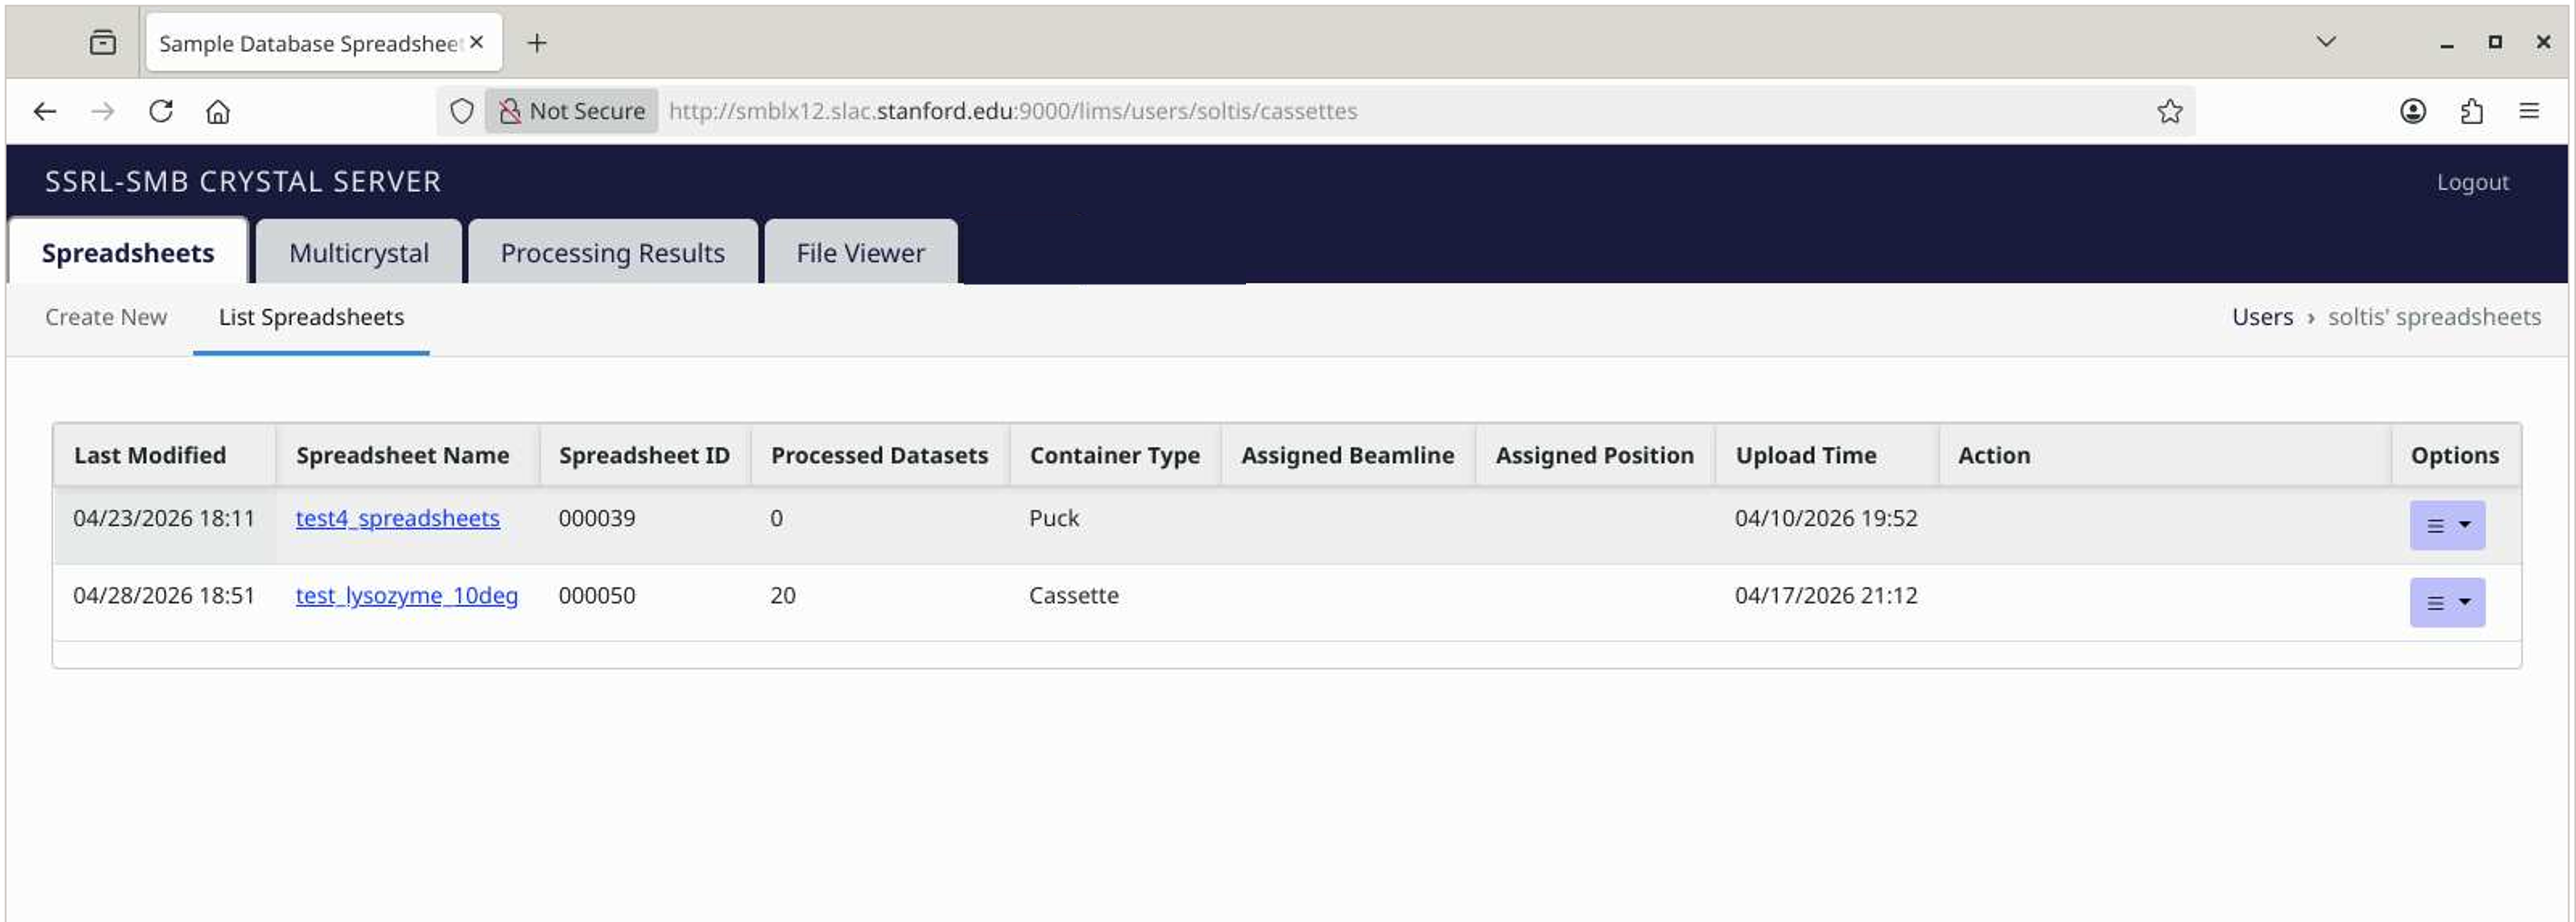
Figure 2. The List Spreadsheet tab displays a list of all the user's spreadsheets. The table displays the following information:
OptionsClick Options to see a list of avaiable spreadsheet actions (Fig. 3):
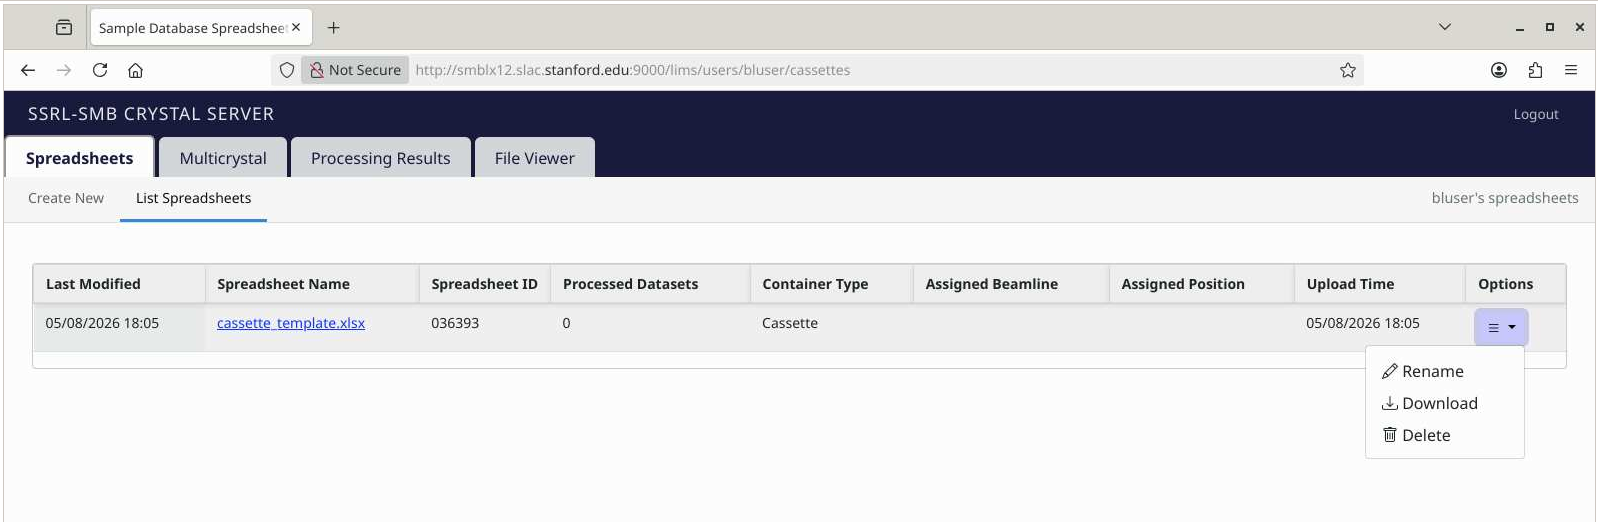
Figure 3. The Options menu for spreadsheet actions. Screening ResultsClicking a spreadsheet name opens two additional tabs: Screening Results and Processing Results for the selected spreadsheet. The Screening Results tab shows results for samples that have been automatically screened, indexed and assigned a quality score in BluIce (Fig. 4). 
Figure 4. Screening results and relevant output parameters are displayed for each sample. Column ViewsUse the Views selection to show more or less parameters: Minimum:
Less adds:
More adds:
All adds:
First Column ChoiceSamples are organized by port, however the first colmun can be changed using the First Column drop down menu (Fig. 5).
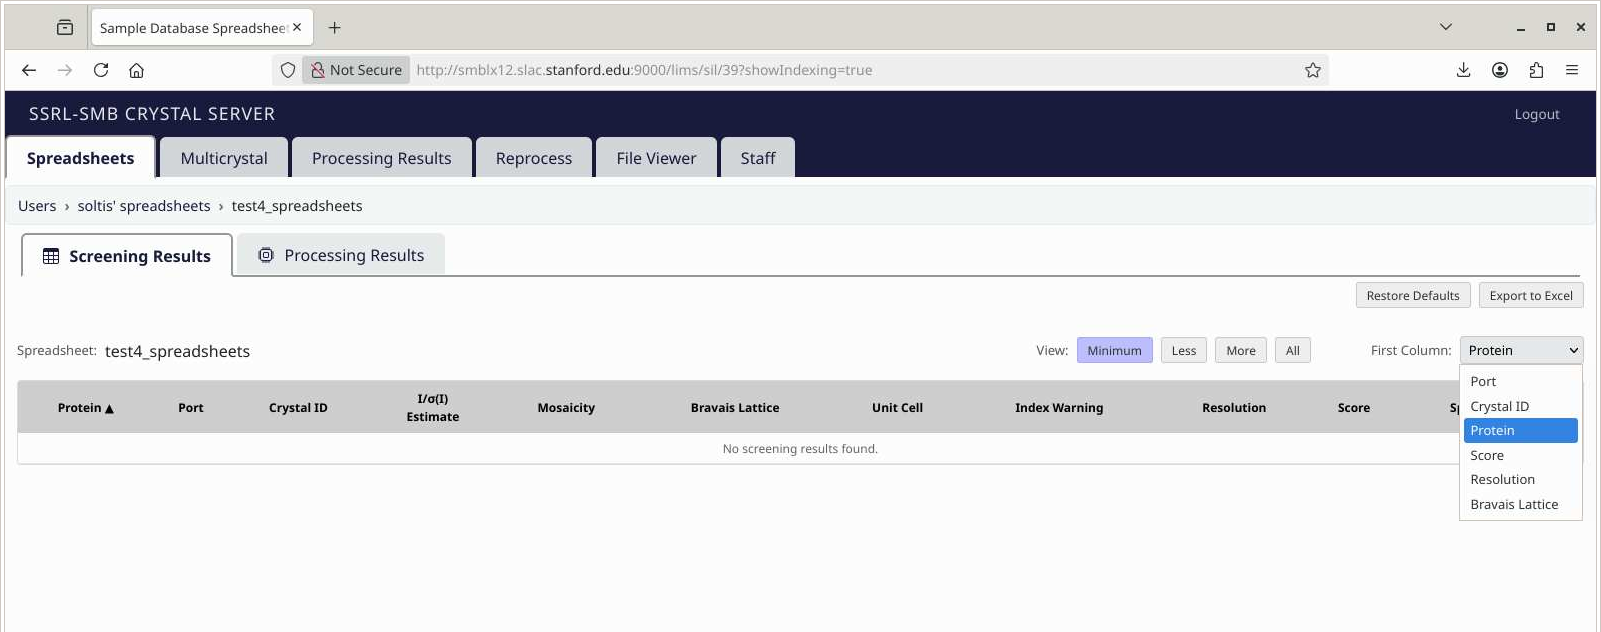
Figure 5. The First Column menu dispalys a list of parameters that can be used for the first column. In addition, any column can be used to sort the results by clicking the column label and toggling the black arrow. The Restore Defaults button will select the Less view, set default column widths and set the First Column to Port. The Export to Excel button will dump the screening tab results into an excel spreadsheet. Processing ResultsThe Processing Results tab appears next to theScreening Results tab, showing autoprocessing data for samples in the spreadsheet (Fig. 6). 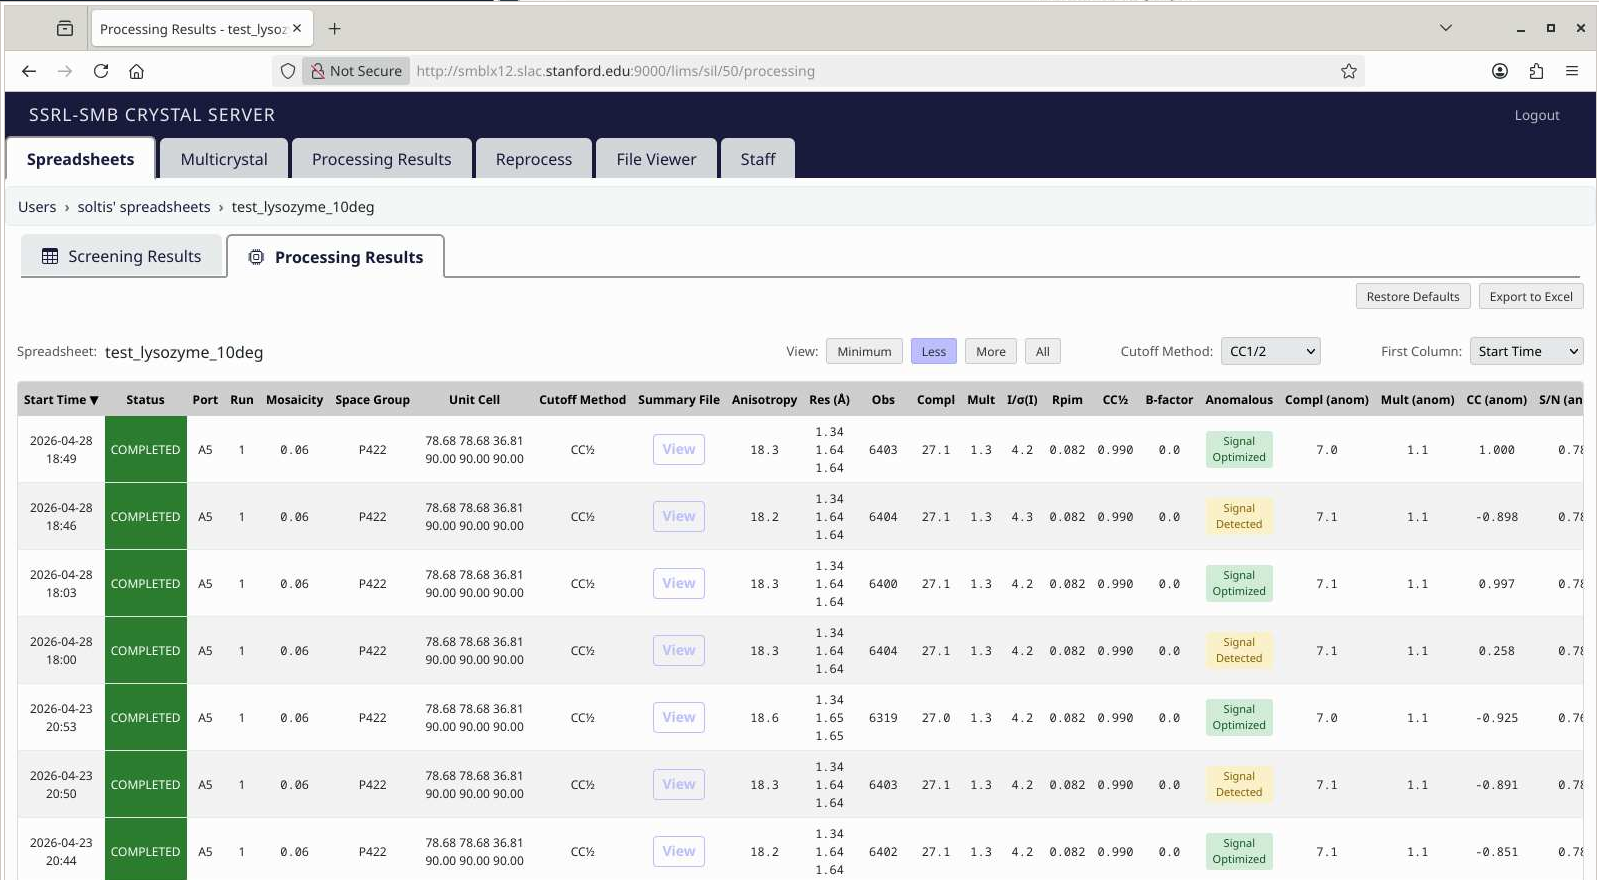
Figure 6. The Processing Results display for a specific spreadsheet. Column ViewsMinimum
Less adds:
More adds:
All adds:
ButtonsThe "Restore Defaults" button returns View to Less, Restores the First Column and all column spacing and sorting. The "Export to Excel" button allows the user to download an excel file with all the processing results associated with the spreadsheet. Each processing method is shown on a different sheet. The “?” button opens a webpage with documentation for the Processing Tab. StatusThe "Status" column indicates the current status of the auto-processing job:
Anomalous Signal DetectionWhen autoPROC detects an anomalous signal, it is reported in the Anomalous column and another processing job is automatically spawned with the -ANO flag and the ExpectLargeHeavyAtomSignal=yes flag to optimize anomalous data processing. The anomalous multilicity can be found in the Multiplicity (anom) column (the Multiplicity column assumes no anomaolous). AnisotropyIn addition to the standard processing method, autoPROC will run an anisotropic analysis. The processing statistics can be flound in the summary.html file under "anisotropic". the program STARANISO is used to determine anisotropic difraction by fitting an ellipse. The "Anisotropy" parameter in the Processing tab is calculated from the 3 axis of the ellipse: Anisotropy = [ [max(res1,res2,res3) − min(res1,res2,res3)] / ave(res1,res2,res3) ] Zero indicates no anisotropy. However, anisotropies above 5% have made improvements (sometimes significant) to electron density maps compared to the standard processing method. If Anisotropy is detected, 3 resolution values will be shown representing the fitted ellipse. Results Summary FileThe "Summary" column shows a View button that will open the summary file in a browser.
How to Interpret Error MessagesIf an error occurs, the Status column will indicate an error and the message will be displayed in the Error column on the Processing Tab. There are two general types of errors:
If there are ICEflow errors, please contact beamline support. autoPROC errors most often reflect issues with processing the data; some of the most common types are:
ICEflow extracts autoPROC error messages from the "top" log file (typically named The autoPROC manual lists a few common errors that can be encountered when running autoPROC as well as a few general suggestions for how to handle them. ICEflow is designed to avoid the more basic errors (for example, all SSRL beamline-specific settings have been implemented already), but if any of these errors crop up, please contact beamline support.
|
||
|
|
||
| Technical questions: Webmaster
Content questions: Mike Soltis |
||
| Last modified:Saturday, 04-Jul-2026 18:40:22 PDT. | ||