Hutch Tab
Overview
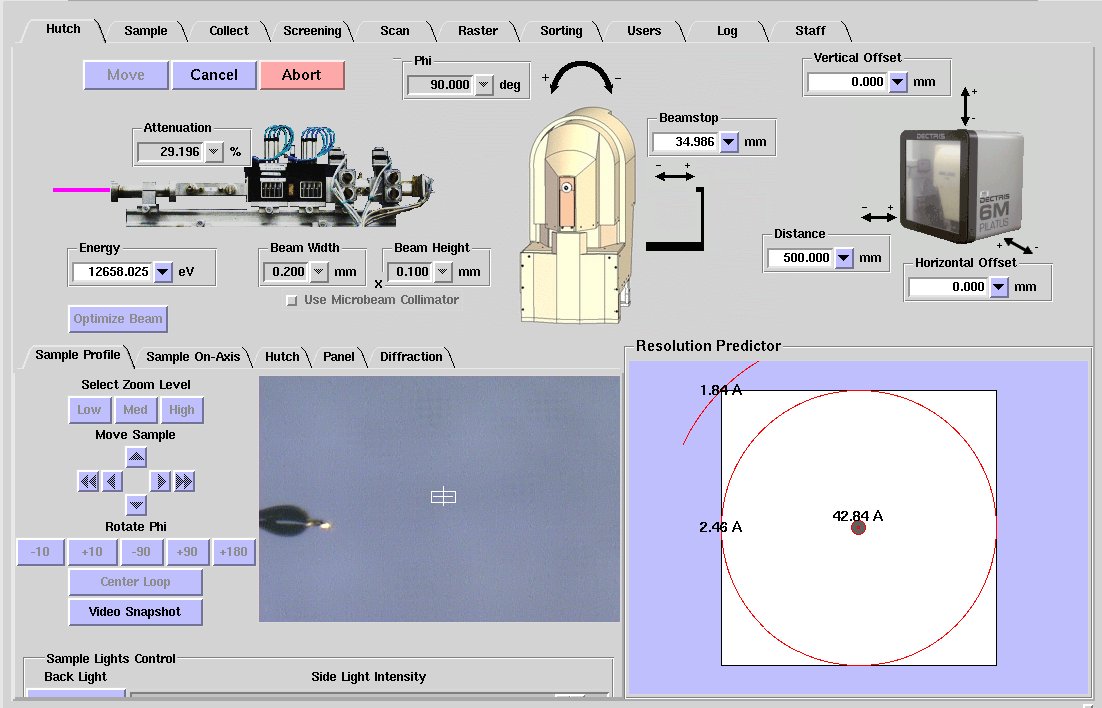
The Hutch Tab allows the users to adjust various
parameters for data collection by entering the desired values into the
input boxes found in the Hutch Overview menu. If changes cannot be
made, the input box is greyed out or inactive, hovering the mouse over
the input box will return an error message. The changes are shown in
red and are not made until the Move button is pressed. Hitting
the Cancel button restores the edited motor values to their
current position. Once the Move button is pressed, and the
changes are initiated, the parameter being changed will be highlighted
in red. Hitting the Abort button will stop the changes while
they are being made. In general, all motors will remain at the
position at which the Abort button was pressed.
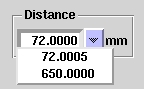
Pull-Down Menus
- The pull-down menus next to input boxes show the minimum and maximum values for the particular control with a range of values in between.
- Any values can be input within this range. Entering values outside the range is strongly discouraged - you may get an error message , or hit a motor hardware limit, which will result in miscalibration of the motor.
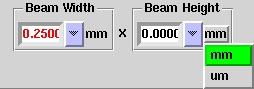
- Clicking on the units will produce another drop down menu with alternative units.
- Clicking on the name of the parameter will produce a window presenting the option to undo the last change of that parameter.
Min. and max. values
|
Alternative units
|
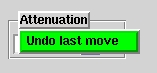
Undo
|
- If your experiment requires data collection outside the range provided, contact
your support staff.
Video Documentation
Please see the Sample Tab for documentation of the sample video widget.
Sample Orientation
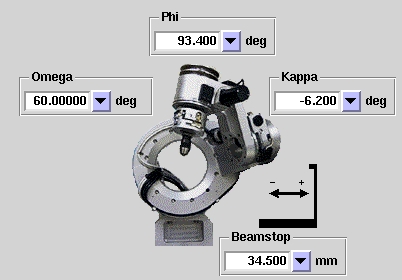
|
Some of the beamlines are equipped with a kappa diffractomenter. The Omega and Kappa motors are locked to avoid collisions with the
detector and other beamline hardware.
If Omega or Kappa values need to be changed, please contact your support staff.
|
Adjusting Beam Attenuation
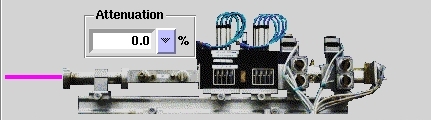
- When the detector is saturated, or has too many overloads, the
beam needs to be attenuated to ensure accurate data
collection. Attenuating the beam can also account for exposure times
shorter than the rotation time of phi. Aluminum filters are used to
attenuate the beam.
- The attenuation provided by the filters will be automatically recalculated if the energy is changed.
- Filters already in place can be seen on video through the panel
tab. On the drop down menu choose the Filter Controller
view.
Critical: Note that it is possible to set the
attenuation for each data collection
run. The value entered for the data collection run will override
the value entered in the hutch tab.
Adjusting Sample Position
See Sample Tab for documentation.
Adjusting Beam Size and Energy
Beam Size
See Sample Tab for documentation.
Energy
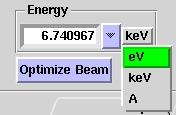 |
- To change the energy use the box labeled Energy.
- When first started, Blu-Ice shows the energy in eV. The energy units can be changed to keV and A by clicking on the
current unit as seen in the second image above. Click Start to initiate any changes that you make.
- The input value must be the same as the selected unit. Entering a value of a different unit will result in an error.
- The beamline control software uses a new scripted device "optimized
energy" which automatically optimizes the energy if it changes by more
than 500eV (including during MAD experiments) and also every 1/2 - 2
hours depending on the beamline.
|
Adjusting Detector Position
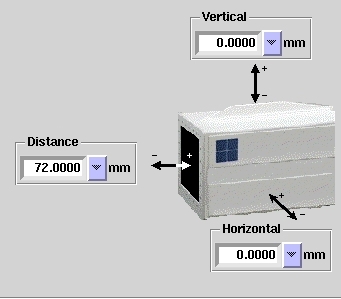 |
- To adjust the detector distance, vertical or horizontal position, change the
values in the corresponding box. You will notice in the Resolution Predictor below
the Detector Position control that the beam center and the predicted resolution
circles move. See Determining Resolution Limits for more details.
- Pressing Start will move the detector to the set position.
- To view the detector position on video, go to the Hutch Tab in the video
section and select overview from the presets on the left.
|
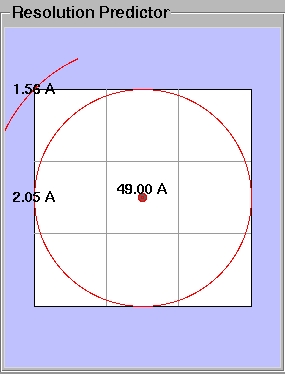
Determining Resolution Limits
- The high and low resolution limit at a particular detector and
beamstop position may be
determined using the box labeled Resolution Predictor. When a
change in the detector position, beamstop position or energy is made, the view in this
box is updated automatically.
- The label on the largest circle that fits in the detector shows
the resolution to which complete data can be collected. Partial
circles limit resolution shells that will be incomplete.
- The label on the smallest circle corresponds to the lowest
resolution to which data will be collected.
- The Vertical and Horizontal positions of the detector (see Adjusting
Detector Position section above) can also be used to determine the amount
of detector offset you may require. Any movement of these positions will
also be updated automatically on the Resolution Predictor.
- If you do not wish to offset the detector, remember to reset
the Horizontal and Vertical positions to the desired
values before starting the data collection.
|
|
|